Part 1 covered the relation between VIX/WVF extreme movements and SPY; here we take a wider look, covering a large number of international equity ETFs.
The main idea behind WVF is that it acts similarly to VIX in high-volatility situations, possibly enough to serve as an implied volatility substitute in cases where such an index does not exist. It can be useful to “confirm” signals based on implied volatility, or to replace them completely in cases where no implied volatility index exists. First of all let’s take a look at an updated VIX & SPY WVF chart:

VIX & SPY WVF
The first post was a while ago, so let’s check how VIX and WVF have performed for SPY since then. The number of signals is very small, and WVF alone has underperformed compared to its historical results, but once again we see that the combination of VIX and WVF offered by far the best results:

Signal results on SPY since 25 Oct. 2012
Let’s take a look at how these signals work internationally:

Close-to-close returns following 100-day 99th percentile VIX return.
It’s clear that using only VIX is pretty useless. Overall the returns are not significantly different from zero, and are even negative in many cases. Let’s check out WVF, which appears to work far better across most ETFs:

Close-to-close returns following 100-day 99th percentile WVF change.
Finally, when VIX and WVF extreme movements coincide, the results look fantastic:

Simultaneous VIX and WVF extreme movements.
Note that even in cases where WVF alone did not show good results (the VT and WVF ETFs for example), combining VIX and WVF still results in great improvement. There is an important, general lesson here about using non-price data as trade set-ups. With few exceptions, implied volatility, breadth, seasonality, etc. need to be “confirmed” by price to actually be useful.
Read more Equity Returns Following Extreme VIX and WVF Movements, Part 2
Can extreme changes in implied volatility help predict future returns? And can we use a VIX surrogate as a substitute? First, let’s take a look at the WVF and its relationship to the VIX.
The Williams’ VIX Fix (WVF) is an indicator meant to roughly approximate the VIX. It can be useful in situations where there is no implied volatility index for the instrument we want to trade. The WVF is simply a measure of the distance between today’s close and the 22-day highest close; it is calculated as follows:

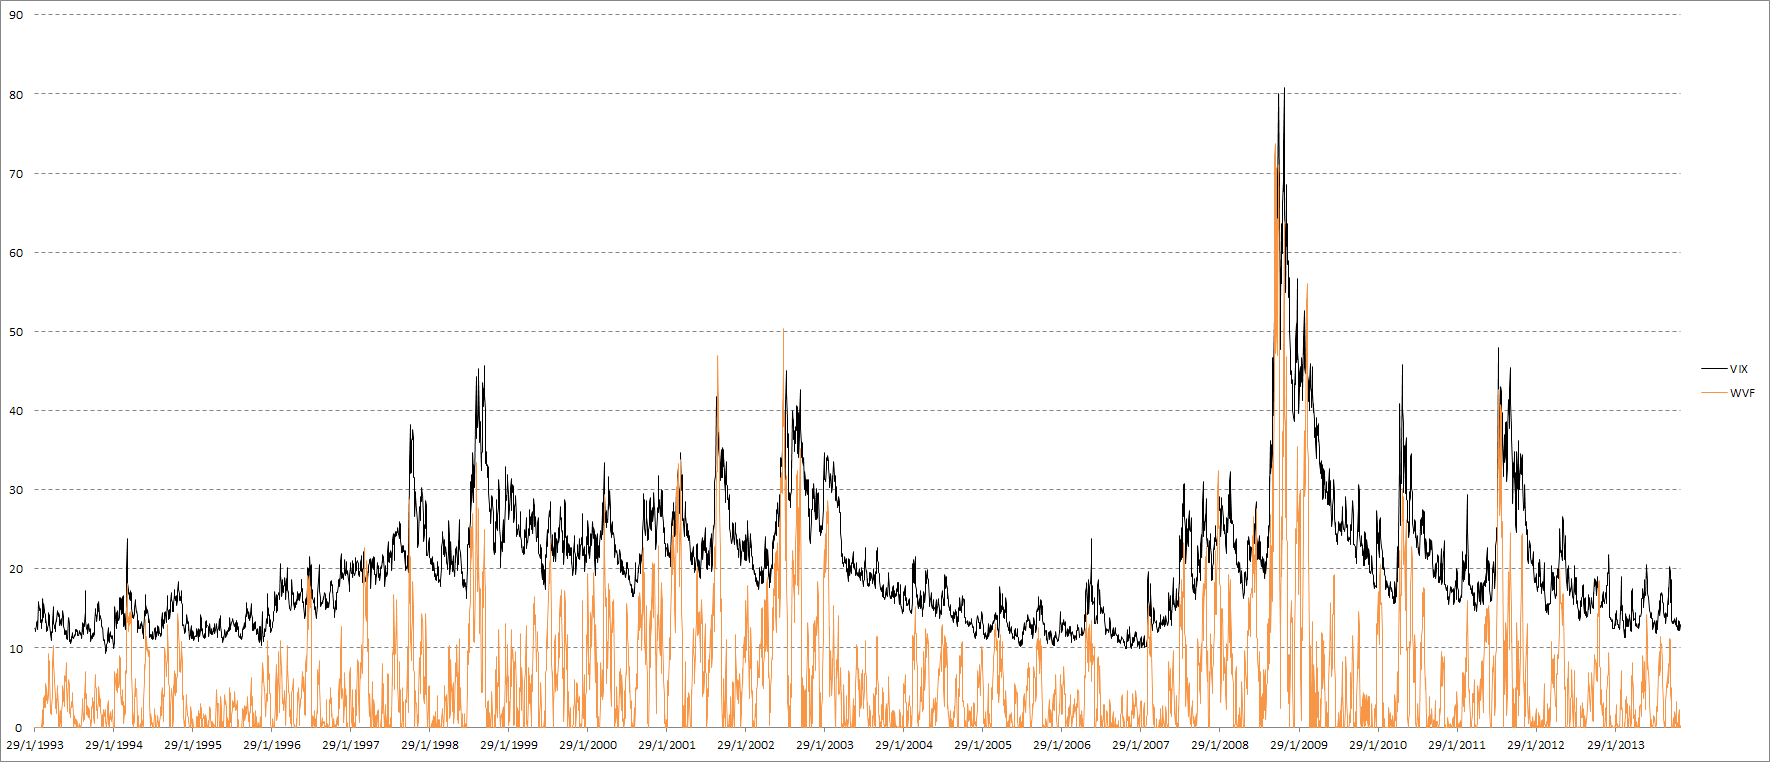
A quick visual comparison between the VIX and WVF:

The WVF and VIX behave similarly during volatility spikes, but the WVF fails to emulate the VIX when it hovers at relatively low values. The correlation coefficient between VIX and WVF returns is 0.62, while regressing VIX returns on WVF returns using OLS results in an R2 statistic of 0.38.
We’re not going to be using the level of the VIX and WVF (hardcoding strategies to specific levels of the VIX is generally a terrible idea), so the above chart is somewhat useless for our purposes; we’re going to be looking at the 100-day percentile rank of the daily change. Here is a comparison over a couple of recent months:

Some times they move in lockstep, other times there seems to be almost no relation between them. Still, for such a simple indicator, I would say that the WVF does a fantastic job at keeping up with the VIX.
As you probably know, (implied) volatility is highly mean reverting. Extreme increases in the VIX tend to be followed by decreases. These implied volatility drops also tend to be associated with positive returns for equities. Let’s take a look at simple strategy to illustrate the point:
- Buy SPY on close if the VIX percentage change today is the highest in 100 days.
- Sell on the next close.
Here’s the equity curve and stats:

Nothing spectacular, but quite respectable. Somewhat inconsistent at times of low volatility, but over the long term it seems to be reliable. What about the same approach, but using the WVF instead?

The WVF outperforms the VIX! A somewhat surprising result…the equity curves look similar of course, with long periods of stagnation during low volatility times. Over the long term the stats are quite good, but we might be able to do better…
There is surprisingly little overlap between the VIX and WVF approaches. There are 96 signals from VIX movements, and 109 signals from WVF movements; in 48 instances both are triggered. These 48 instances however are particularly interesting. Here’s a quick breakdown of results depending on which signal has been triggered:

Now this is remarkable. Despite performing better on its own, when isolated the VIX signal is completely useless. This is actually a very useful finding and extends to other similar situations: extreme volatility alone is not enough for an edge, but if used in combination with price-based signals, it can provide significant returns. I leave further combinations on this theme as an exercise for the reader.
A look at the equity curve of “both”:

Long SPY when VIX % change and WVF change are both the highest of the last 100 days, $100k per trade, 1993-2012, no commissions or dividends.
Now that’s just beautiful. You may say “but 37% over 20 years isn’t very impressive at all!”. And you’re right, it isn’t. But for a system that spends almost 99% of the time in cash, it’s fantastic. Want more trade opportunities? Let’s see what happens if we relax the limits on “extremeness”, from the 99th percentile through to the 75th:

Net profit increases, but profitability per trade, and most importantly risk-adjusted returns suffer. The maximum drawdown increases at a much faster rate than net profits if we relax the limits. Still, there could be value in using even the 50th percentile not as a signal in itself, but (like the day of the month effects) as a slight long bias.
Finally, what if we vary the VIX and WVF limits independently of each other? Let’s have a cursory look at some charts:

As expected, the profit factor is highest at (0.99, 0.99), while net profits are highest at the opposite corner of (0.75, 0.75). It’s interesting to note however, that drawdown-adjusted returns are roughly the same both along the (0.99, 0.75-0.99) and (0.75-0.99, 0.99) areas; as long as one of the two is at the highest extremes, you can vary the other with little consequence in terms of risk-adjusted returns, while increasing net profits. This is definitely an area deserving of further analysis, but that’s for another post.
That’s it for now; I hope some of these ideas can be useful for you. In part 2 we’ll take a look at how the above concepts can be applied to international markets, where there is no direct relation to the VIX and there are no local implied volatility indices to use.
Footnotes
Read more Equity Returns Following Extreme VIX and WVF Movements, Part 1