Part 1 covered the relation between VIX/WVF extreme movements and SPY; here we take a wider look, covering a large number of international equity ETFs.
The main idea behind WVF is that it acts similarly to VIX in high-volatility situations, possibly enough to serve as an implied volatility substitute in cases where such an index does not exist. It can be useful to “confirm” signals based on implied volatility, or to replace them completely in cases where no implied volatility index exists. First of all let’s take a look at an updated VIX & SPY WVF chart:
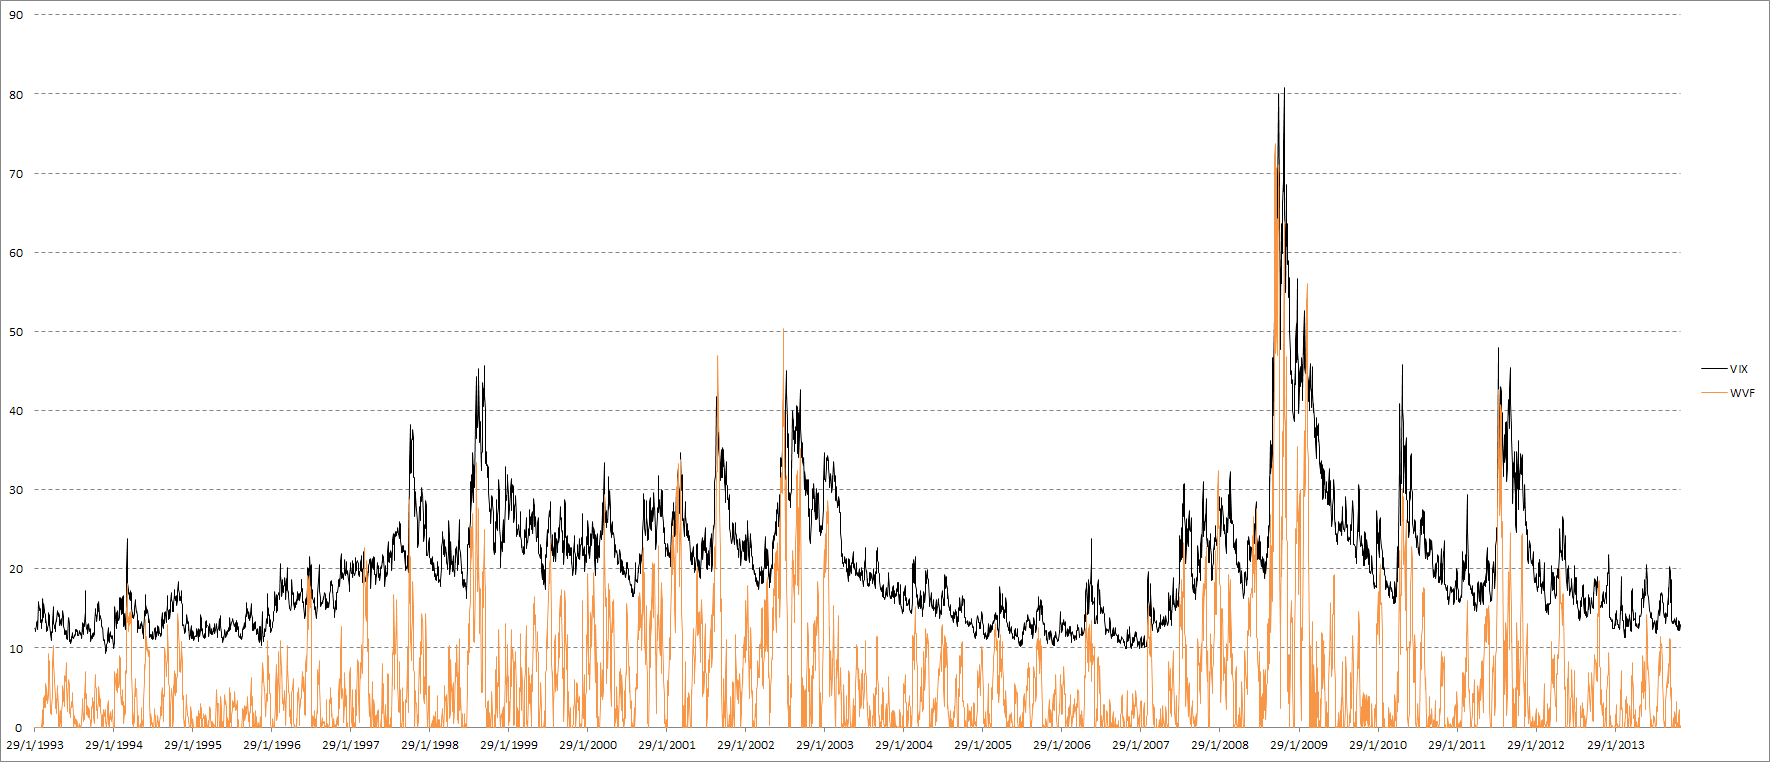
VIX & SPY WVF
The first post was a while ago, so let’s check how VIX and WVF have performed for SPY since then. The number of signals is very small, and WVF alone has underperformed compared to its historical results, but once again we see that the combination of VIX and WVF offered by far the best results:

Signal results on SPY since 25 Oct. 2012
Let’s take a look at how these signals work internationally:

Close-to-close returns following 100-day 99th percentile VIX return.
It’s clear that using only VIX is pretty useless. Overall the returns are not significantly different from zero, and are even negative in many cases. Let’s check out WVF, which appears to work far better across most ETFs:

Close-to-close returns following 100-day 99th percentile WVF change.
Finally, when VIX and WVF extreme movements coincide, the results look fantastic:

Simultaneous VIX and WVF extreme movements.
Note that even in cases where WVF alone did not show good results (the VT and WVF ETFs for example), combining VIX and WVF still results in great improvement. There is an important, general lesson here about using non-price data as trade set-ups. With few exceptions, implied volatility, breadth, seasonality, etc. need to be “confirmed” by price to actually be useful.
justin long says:
great post. interesting how combining the two signals produces such enhanced returns.
is the final table using the same data set (which looks like it went back about 20 years)?
how many trades does each etf generate (i.e. is it more or less than the 2.5/yr that spy generated)? thanks!
qusma says:
Yes the number of trades is similarly tiny for every ETF. Obviously you can get more trades by relaxing the “extremeness” limit, for example by moving from 99th percentile change to 95th percentile change for both quintuples the number of trades (but they’re not as good)… Here’s some stats: https://docs.google.com/spreadsheet/pub?key=0Ar6kbZGbHAQmdGI3eURlRVRQQlJEUDIwZVRnRUVPQnc&output=html
justin long says:
thanks. i see exactly what you are saying about more trades but less edge per trade.
Alex says:
thanks again for quite interesting post!
i am curious what you think if one would apply the idea to the whole stock market by finding the best parameters for WVF indicator (lookback window) and for lookback/level of percentile rank – is it kind of curve fitting by definition? i took for example all the liquid stocks which were traded before 1995 and found the best parameters since 1995 up to 2010 but the results OOS for those selected by some metric (i tried sharpe, correlation to some ideal trend and some others) are not much different than just weighted average of those stocks since 2011 till now…
qusma says:
Well first of all individual stocks behave quite differently from indices, so I’m not sure if the approach is valid there as well. Obviously there is some element of “curve fitting” to everything that involves parameters, as long as you don’t over-fit you’ll be fine though.
I’m not sure what you mean by “not much different than just weighted average of those stocks since 2011 till now”, what are you comparing exactly?
Alex says:
so what i meant is that when one picks up in-sample “the best” stocks/etfs according to the strategy and then uses them out-of-sample than the equity curve looks very similar to the case of equally weighted portfolio of this selected stocks/etfs at least as of 2011.
in my experiment what i did is found about hundred of stocks/etfs with more or less suitable trade stats in sample (1995-2010) and then used them to construct portfolio such that it was allowed to allocate in each instrument not more than 1/3 of capital and not less than 1/10 depending on how much signals i had per day.
i should mention that i didn’t use the vix itself as an additional signal so maybe this is where the problem is.
qusma says:
That’s interesting, what transaction costs do you assume? What’s the average daily return?
I just ran a similar-ish test myself on the 100 largest S&P500 stocks (no optimization or any specific selection of stocks). Got an average return for the WVF signal of .238%, but it’s not really enough to beat transaction costs by a significant margin. Since 2010 it has actually gone even better, with .334% returns on average…VIX & WVF together gives .982% avg ret, but obviously a much smaller number of trades.
Alex says:
i didn’t use any transaction costs in this case just to see what one can squeeze out of the system. i used three types of performance metrics to pick the instruments based on the results in-sample. here is what i got ouf-of-sample
metric/mean daily return/mean number of trades
sharpe/0.43%/12
correlation/0.32%/17
winrate/0.44%/13
but this is just some sort of mean stats – i was not able to construct a portfolio using this results with more or less attractive performance – maybe you could give an advice on what to do…
qusma says:
Ah, that makes sense. Naturally with the tiny number of trades you can’t really use this as a “stand-alone” system to construct a pfolio with. I think the mean daily return is very respectable though, no?
Alex says:
yes definitely =) thank you for sharing your thoughts!
2013: Lessons Learned and Revisiting Some Studies says:
[…] Equity Returns Following Extreme VIX and WVF Movements, Part 2 […]
Equity Returns after Extreme VIX and William VIX FIX Readings says:
[…] just going thro QUSMA blog on Equity Returns Following Extreme VIX and William VIX FIX Movements. And couple of peoples are throwing ideas on implementing the strategy with percentile rank […]
shervin says:
These results will help any user. Special thanks.
لامپ کم مصرف–کرکره برقی–راهبند اتوماتیک–درب پارکینگ–راهبند